You’ve conveniently focused on Chelsea being bottom on fouls-to-yellow-card ratio while completely ignoring that Spurs are bottom for penalties relative to touches in the box. That rather matters.What patterns other than penalties have been there the last 3 years - show me?
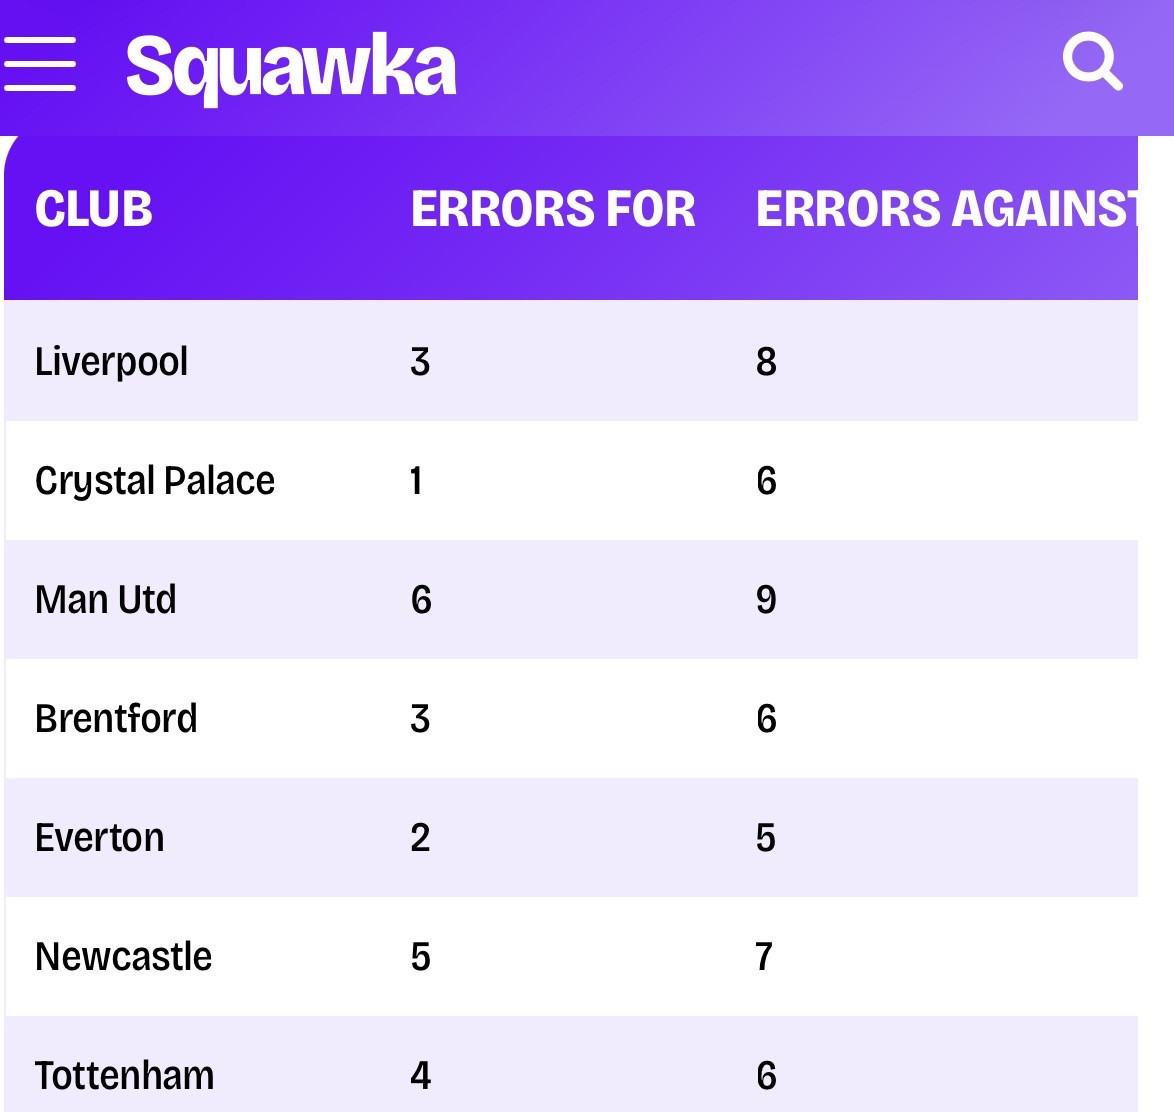
Last year we were second top of the card to fouls ratio - Premier League Team With Most Fouls Per Yellow Card 24/25 | StatMuse
And our fouls-to-tackles ratio this year is very very normal compared to last years average
If anything, this data shows Chelsea to be suffering 'bias' by this metric much more than us .
Because the argument has never been that one isolated stat proves corruption or bias. It’s the accumulation of trends across multiple subjective areas of officiating over several seasons.
Spurs consistently rank among the highest sides for touches and entries into the box, yet somehow sit bottom when it comes to getting penalties relative to those attacking actions. Meanwhile Chelsea can complain about card thresholds all they like, but they’re still benefiting in another massive subjective area by being near the top for penalties awarded.
That’s why the comparison doesn’t really work. You’re selectively choosing one metric where Chelsea look hard done by while ignoring another where they massively benefit. Spurs’ issue is that the imbalance keeps appearing in the same direction across different categories and across multiple seasons.
You’ve also picked out last season alone. What about the season before, where Spurs were top five for yellow cards received and one place down on fouls-to-yellow-card ratio? Funny how that part gets ignored. And when you repeatedly look across these kinds of stats, the same clubs constantly seem to appear at the other end benefiting from them. Woolwich, Liverpool and City repeatedly end up with more favourable numbers when it comes to penalties, card thresholds and subjective officiating trends.
People also keep acting like bias has to mean Spurs are literally bottom of every refereeing metric every single year for concerns to be valid. That’s not how human bias works anywhere in real life. Not in policing, courts, workplaces or sport. It shows up in marginal decisions, thresholds, interpretations and cumulative outcomes over time.
And football officiating is almost entirely subjective. What counts as enough contact, clear and obvious, game management or a natural position changes depending on the referee, the atmosphere and often the teams involved.
That’s why people point to the repeated penalty anomalies, inconsistent VAR interventions, different card thresholds, ignored shirt pulls and box incidents, constant PGMOL apologies and obvious inconsistencies in how similar incidents are judged from one match to another.
One graph on its own means little. One season means little. But when the same kinds of patterns keep appearing over three years, people are naturally going to question whether unconscious bias plays a role. Pretending referees are somehow immune from that despite former officials openly admitting pressure and perception influence decisions just isn’t realistic.